At the moment we are all loving connecting with family and friends through Zoom. Where would we be without video calling these days? You have to love and embrace the technological age that we have been blessed with, especially during these difficult times.
Tonight, I just wanted to write a quick blog to share a really useful tip for those who create maps and automated reports within Alteryx. In particular for those times when you are trying to zoom in around a particular area around a map or when you have catchments or areas that have smaller areas too far away to be significant but you don’t want to remove them and you need to zoom into the main area of the catchment as that is the focus of the task in hand. You know when you have this:

Well I have a useful tip for you!

Let me walk you through…
Within the first container, I am just creating an example dataset to work with here, just a few points and a trade area tool to create a polygon with a separate polygon away from the main area. When we report on that it gives the following which you have already seen, but just for completeness:

As you can see this makes the main area of the map not the centre of the focus and directs your eye around Coventry and Rugby. When in fact you need to be focusing on that not so hidden Mickey over Northampton.
As this is one multi-polygon, we first need to start by splitting the polygon into detailed regions and then finding the area of these regions individually. Keeping its RecordID, especially if we are working with a larger dataset or automation for reporting.
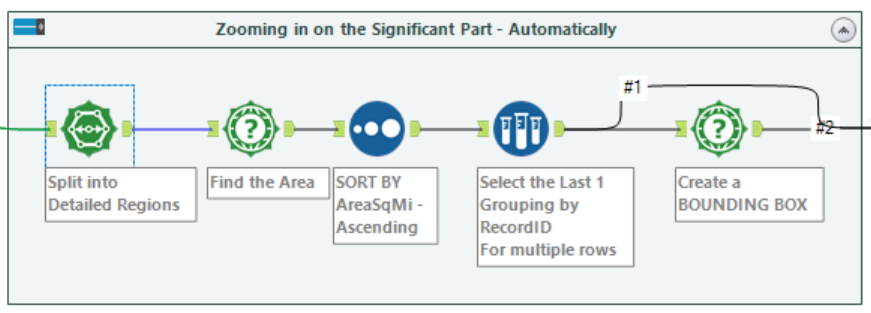
So we do this with the Poly-Split tool followed by the Spatial Info tool.

The next logical step here would be to select the larger polygon from each catchment or multi-polygon area that you have by using the sort and sample tools (ensuring that you group your data using your RecordID in the sample tool).

Once you have your area of interest selected for each RecordID create a bounding box using another Spatial Info tool.

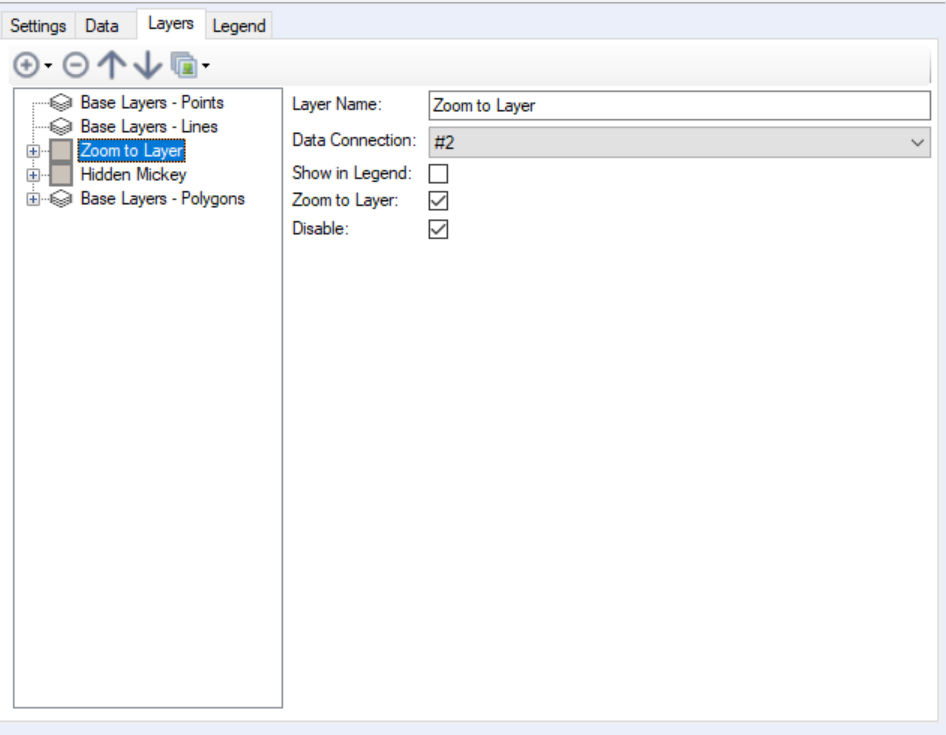
The final part to this magic is to set up your Report Map tool correctly, because you want two feeds of data, you need the data itself and then you need the bounding box. You can see in the images below that we use the bounding box data feed (renamed as Zoom to Layer) but we don’t display it or show it in the legend, we only use it to zoom in. Then the data itself we show in the legend.

Then as if by magic, you get the following:

A much better centralised image on the area of focus and directs the reader directly where they need to be compared to our previous image of:

This could easily become a macro with a drop down selection for RecordID and another for selecting the spatial object. Then you could have the option of selecting the larger item in the object set or the smaller item and then amend the sort to suit.
In summary I have guided you through how to zoom into specific areas of your multi-polygons, for reporting automation, within Alteryx so that your user can see instantly what you are trying to share with them via the report map tool.
