During the COVID19 Pandemic, I was asked to provide some maps and support with the automation of the downloading of the data. This was all going great just like your normal workflow until the UK Government and PHE decided to change their website. Cue another day or two added to the job. Life’s little pleasures.
The new website: https://coronavirus.data.gov.uk/
Its simple enough, however they have been exceptionally clever and locked down their download links for the data on the front end.
*o*
During this blog I want to support other businesses who also may need this data and need to automate the feed into their databases so that it can feed internal maps.
So how did I find this access to the data?
Using the developer tools, I was able to look at all the necessary parts that create the webpage. To do this you need to hit F12, go to the Network Tab and hit Refresh on your page and it will fill up with lots of information.

On the Network tab you have the ability to filter, you can filter by anything here, in this example I used “json” and it brought back this very useful list. Lets take a closer look.

Now I dont know about you but that second entry down is looking very promising indeed. “data_202004171502.json”
To give it a try, right click and copy > link address.
Paste this into a new web browser and you get the following:

This is perfect, exactly what we need, it has the local authority regions, along with the numbers of cases and deaths and the relevant date. I already have the spatial boundaries to match this data feed, so I am happy to proceed to automate collecting this file from the website daily.
So lets break down the file URL:
https://c19pub.azureedge.net/data_202004171502.json
We have three parts here which are relevant, the URL Prefix “https://c19pub.azureedge.net/data_”
The date and time the file was uploaded “202004171502”
and finally the file type “.json”
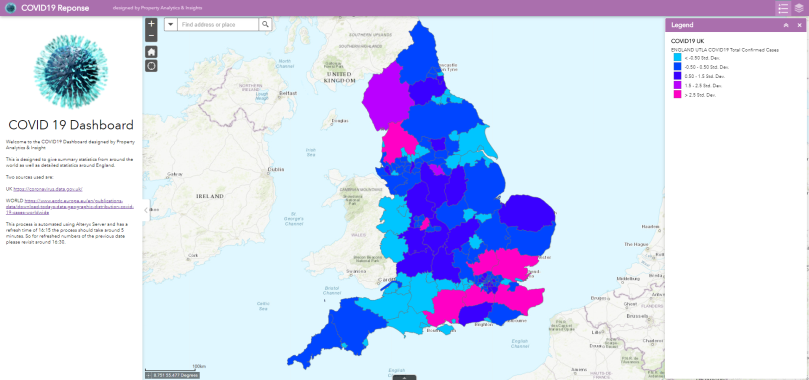
The only part here which needs thought is the date and time element. This is due to not knowing when they are likely to upload the file in the day. If it was just the date, that part would be easy but as you can see there is a 1502 at the end which represents it was uploaded at 15:02. We can verify this by viewing the website image at the start of the blog, review the date the page was last updated.
Ah, so automate the grab of that you think and then you have the date and time, nah its not there in the standard HTML grab of the website using the download tool. Now I had an option here to move over to the Python and Selenium methods or stick with Alteryx and Base A. I know Alteryx can do this, so I stuck with it.
Generate Rows
So I know the file has today’s date when updated, or the previous dates when running it (be mindful of that). So that part is covered, dealing with the time problem was as simple as generating rows for every minute of the day from 00:00 – 24:00 or 0 to 2400. This way I would be able to “catch” which ever time the file was updated and using the Download Headers from the download tool, you can easily filter out the correct winning file.

Now because the generate rows tool doesn’t present the number into the 4 characters required for time, it is important to use a formula tool to PAD LEFT that baby out to 4 characters with 0s.
Within the formula tool, I also build up the URL back up with the prefix, add the new calculated date and time and then finally the .json. This is what is fed into the download tool.
The data is in JSON so of course, a JSON parse is the best tool here to break it down for transformation.
Alternative and faster method…
So after some valuable comments on this post I was able to dig deeper into the website and find the following: (Thank you James & John)
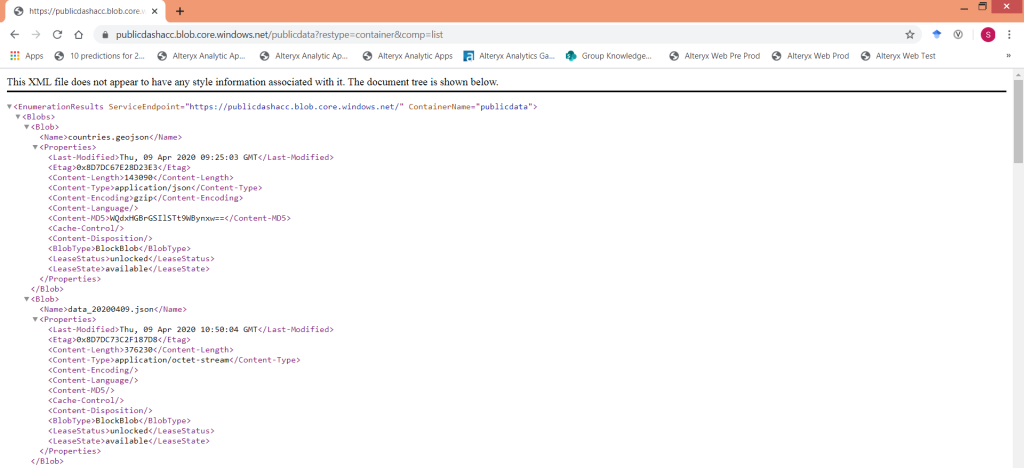
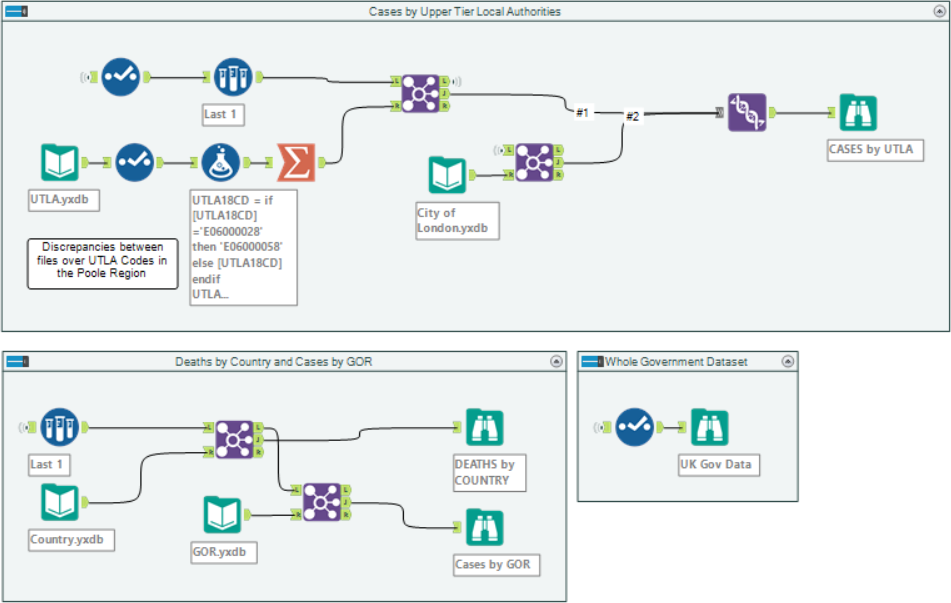
What is it you ask? It is an XML list of the items within an Azure Blob container, completely overlooked the first time I viewed this site, because I was specifically looking for .json and other data files. What is useful about this link is that it tells us the name of every file within that container. So we no longer have to “guess” the file time, we can find the list of files, discover which one is the latest one and then download that. I revised my workflow and it now looks like this:

Because we are not hitting 2400 web pages, this process is now 10 x faster, so worth the change.
Back to the transformation…
Then finally once I have the data how I needed it I created a few spatial layers.
The whole process runs in just over a minute (revised time, around 5 seconds!!) and can be run every day on an Alteryx server to update all your data feeds. Therefore keeping you up to date with the COVID19 stats within your business domain. With the daily shift of numbers and different areas being impacted more than others its important to stay ahead. Automation is the key.
This then leads to creating wonderful maps in ESRI to be able to feed to the business to support our decision making.